Welcome to this video where we will show you how to generate reports from analytics used for analytical graphics to meet company requirements. Let's look at the steps:
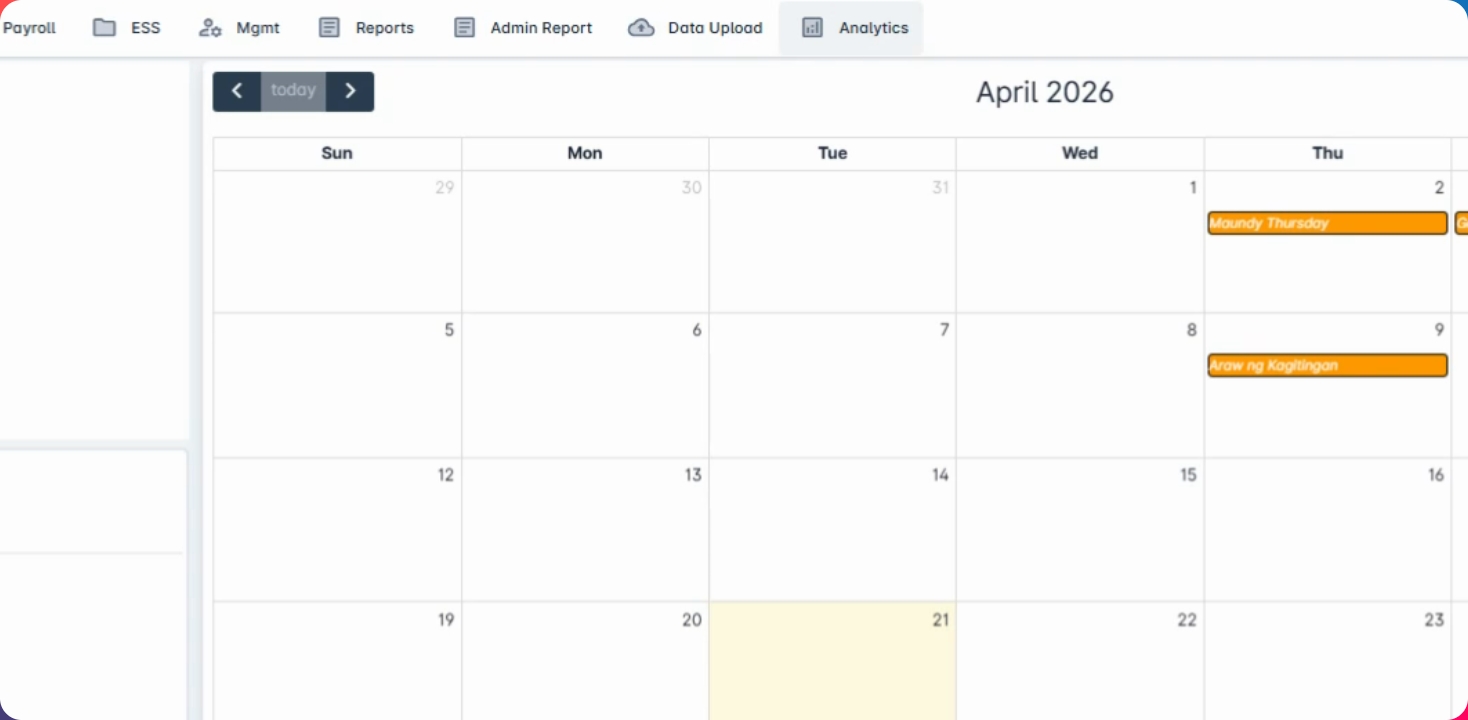
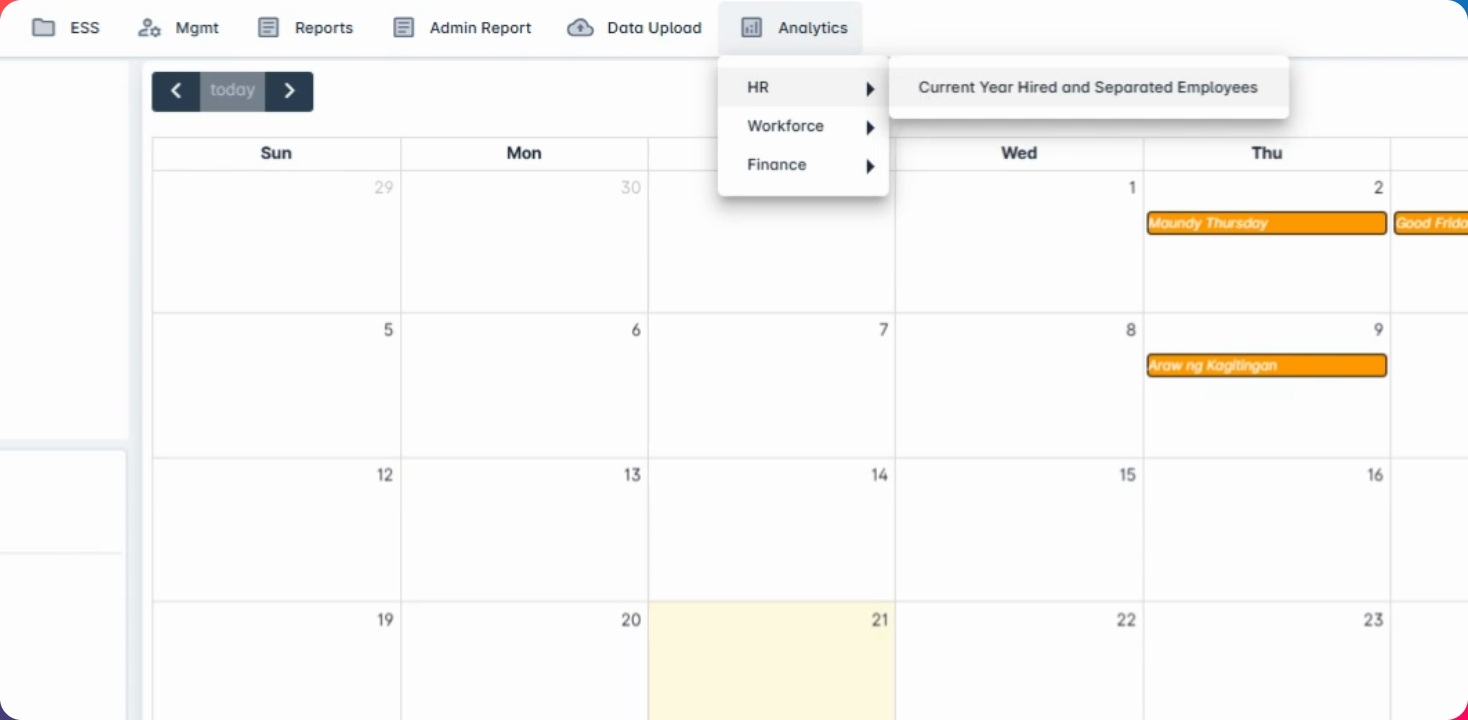
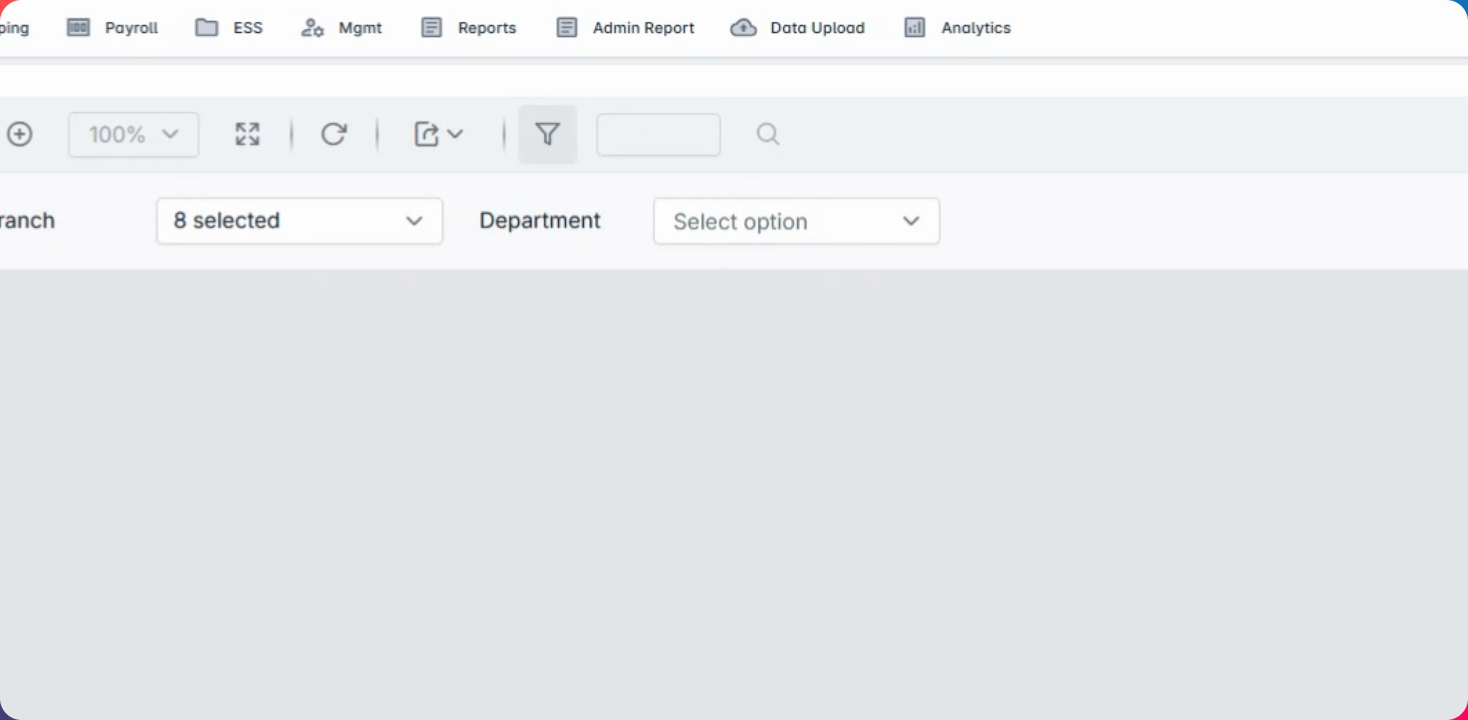
Step 1: Go to Analytics
To proceed, go to Analytics where you will find the current year hired and separated employees for each of the reports.
Step 2: Select Companies
Select one or multiple companies from your sub company or select all.
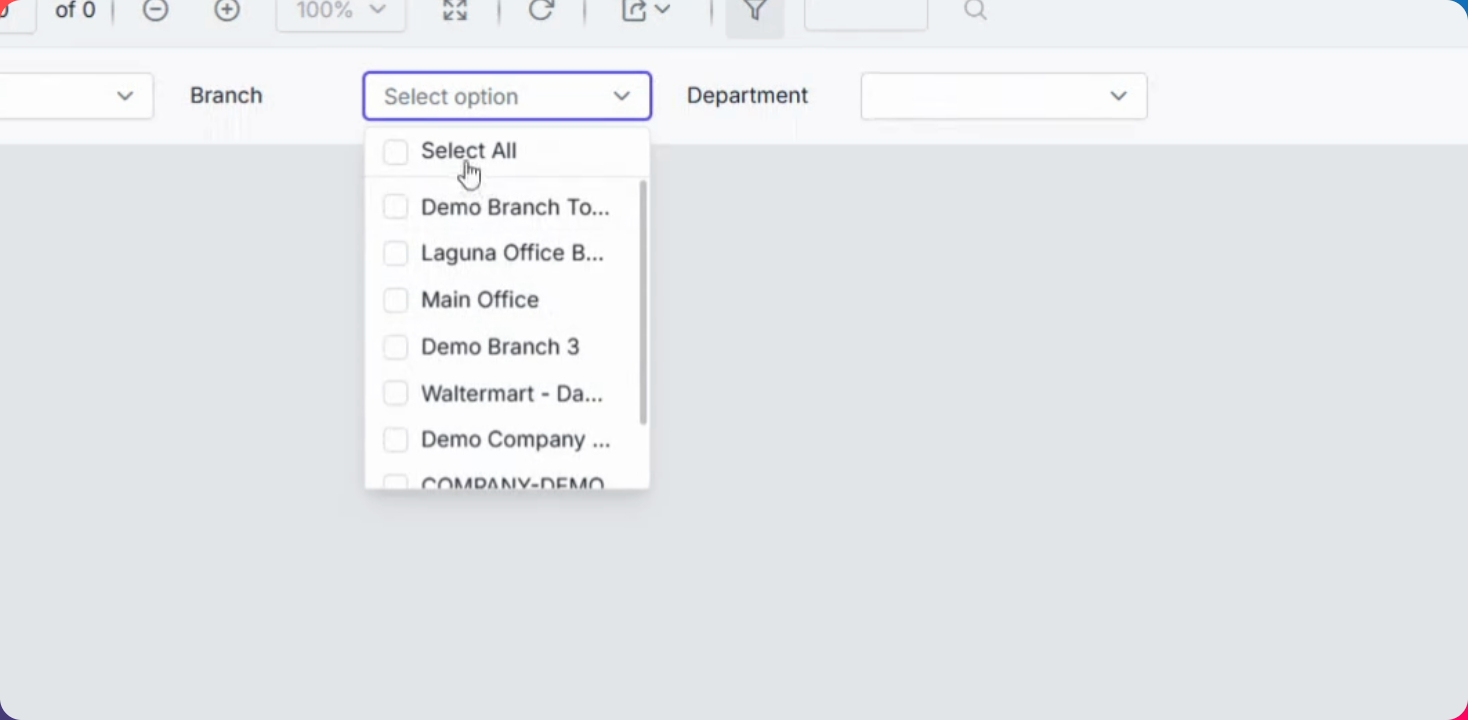
Step 3: Select Branch
You can select all, multiple, or one branch.
Step 4: Select Department
For department selection, you can choose one or more departments, or no department at all.
Step 5: View Report
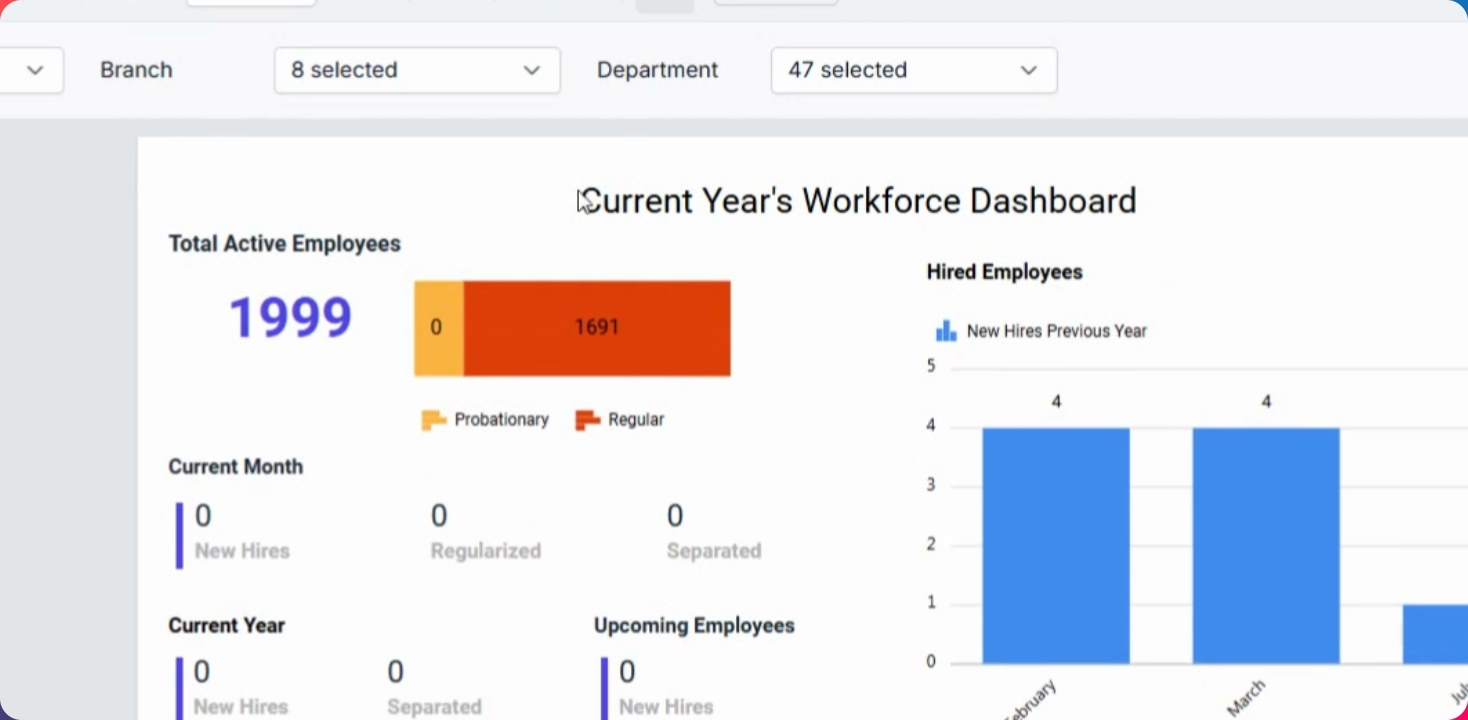
Click View Report to view the report, which will reflect the preview from this portion.
Step 6: Export to Excel
You can export the report to Excel if you wish to have a permanent copy.
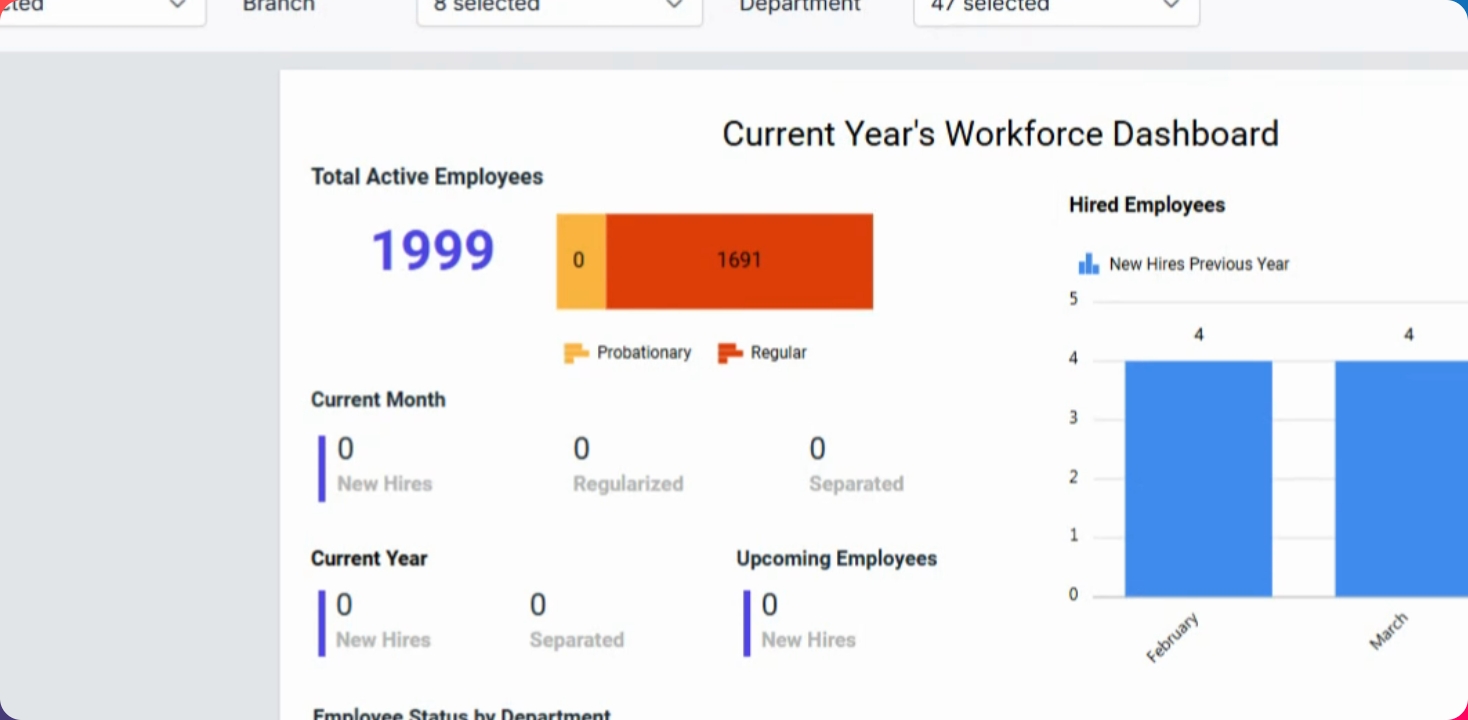
The current year's workforce dashboard includes total active employees, provisionary and regular hires, and various graphs for employee status per department.