In this tutorial, you will learn how to generate reports of analytics in HR. Let's look at the steps:
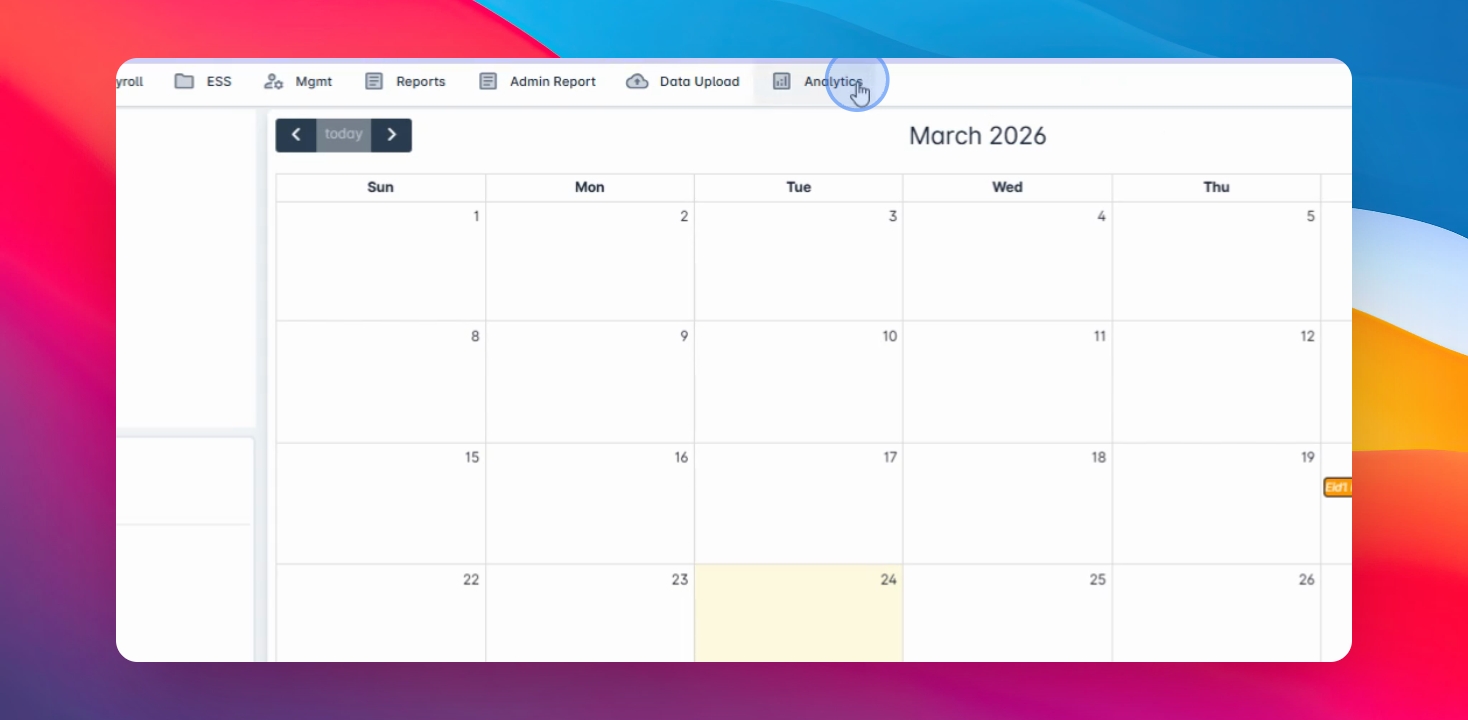
Step 1: Navigate to Analytics Module
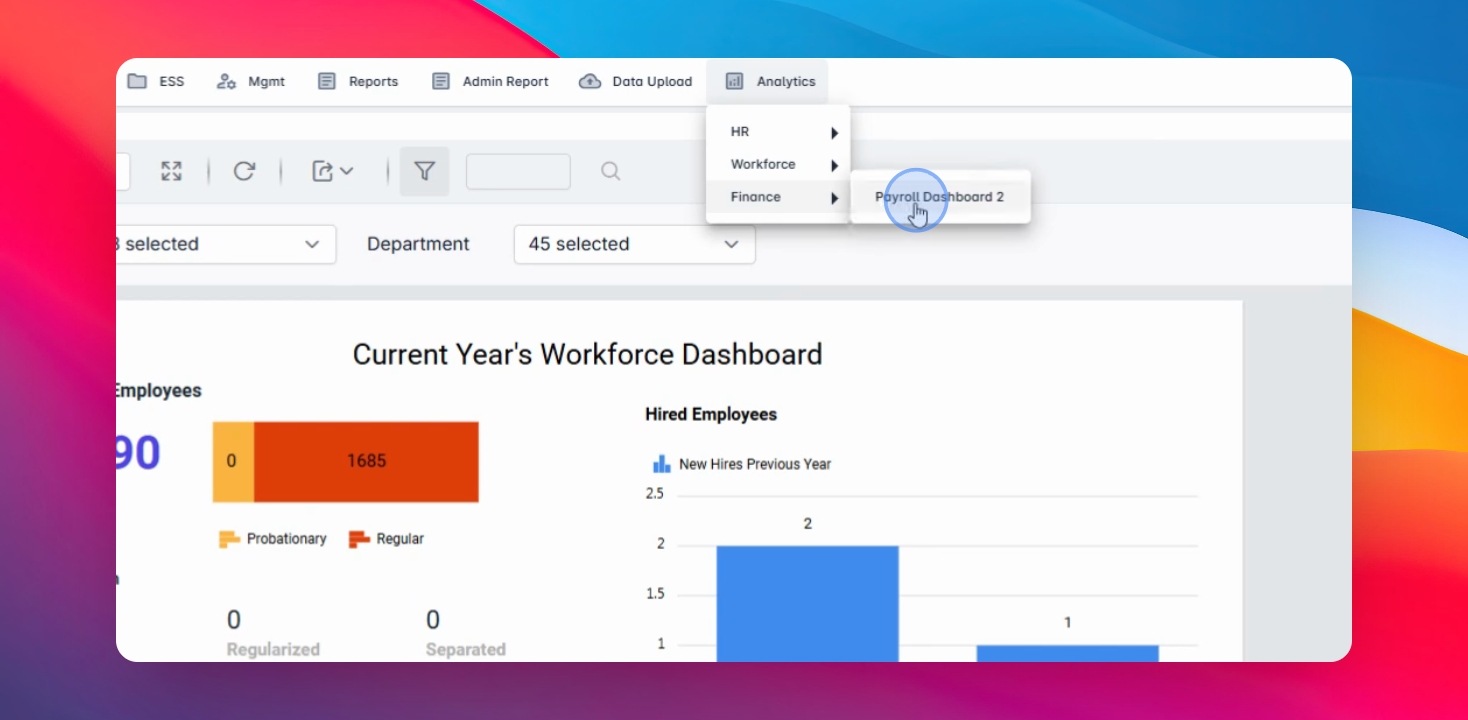
To begin, navigate to the analytics module where you have analytics ready for HR, workforce, and payroll
Step 2: Select Department
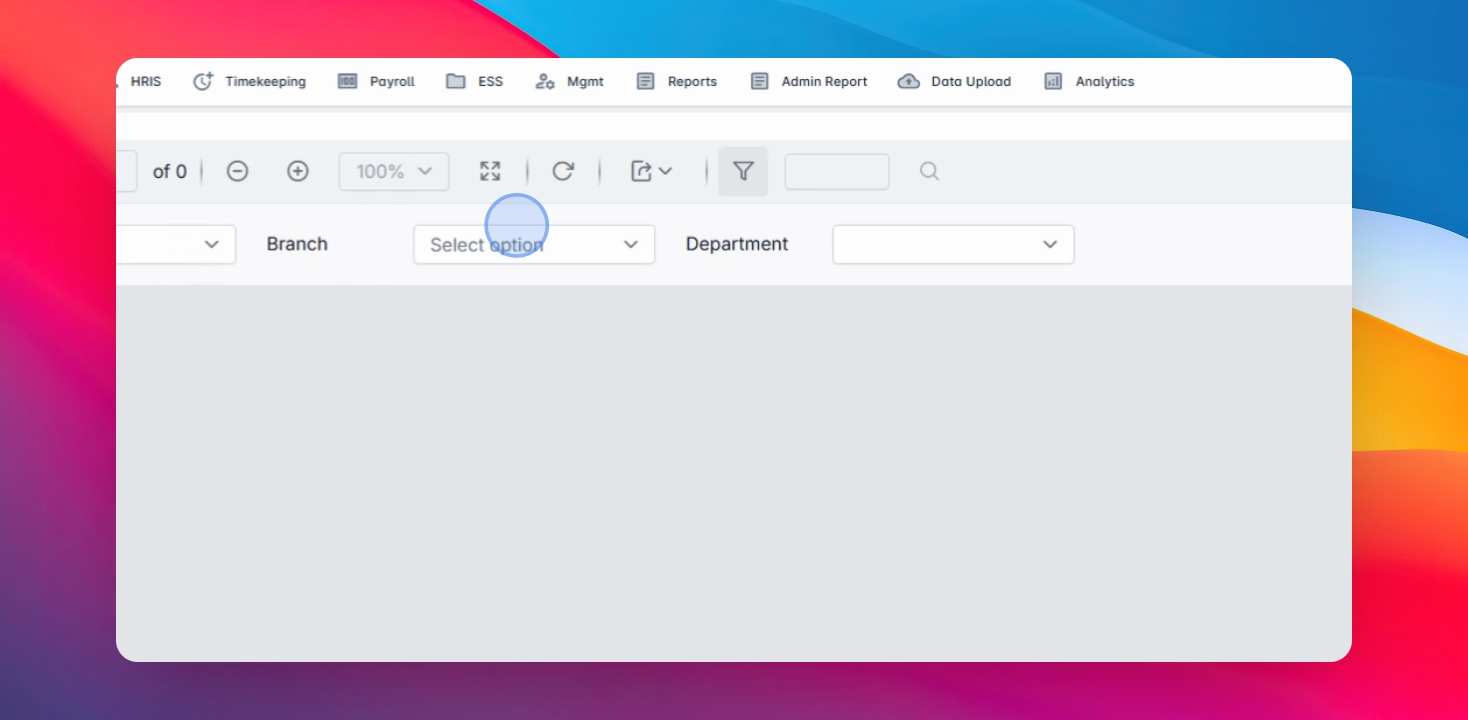
If you have multiple companies, branches, or departments, you can select one department or select all and click on View Report.
Step 3: View Workforce Dashboard
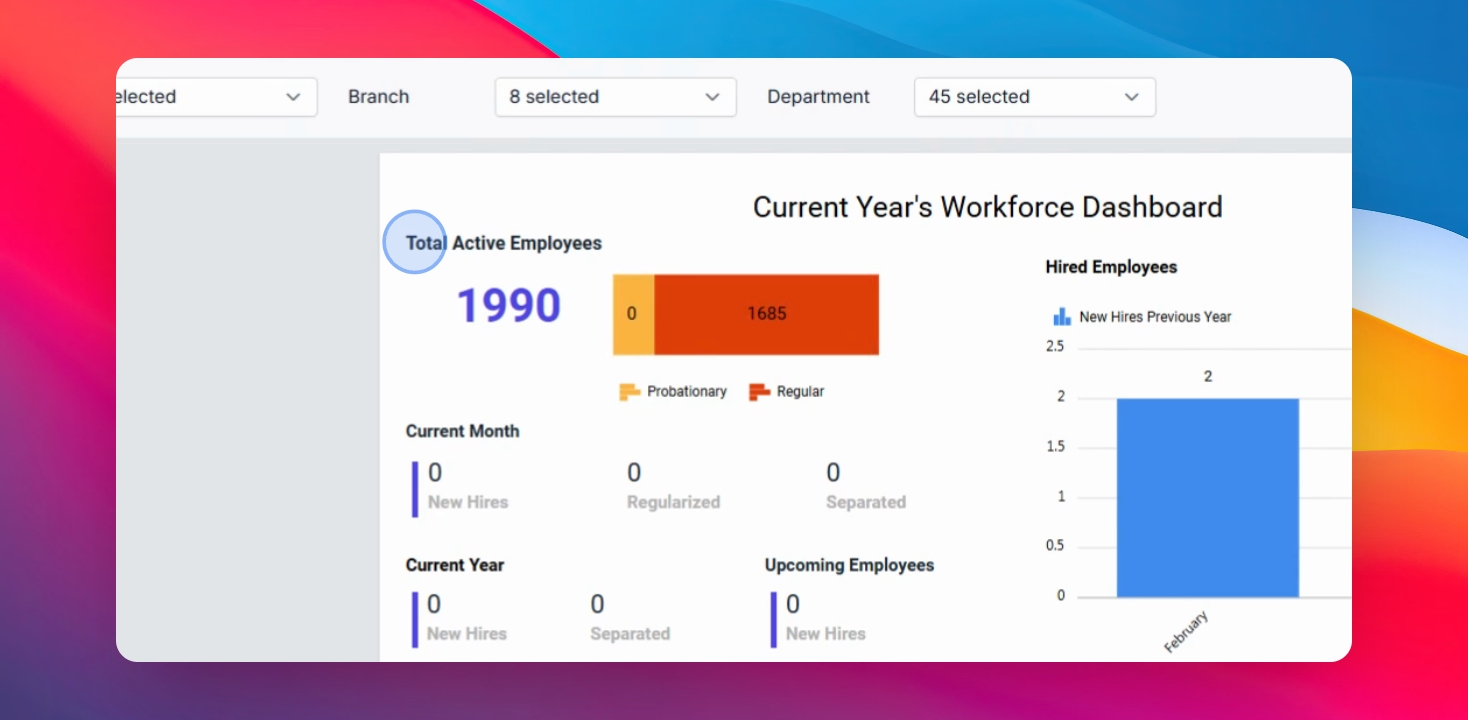
Here you can see the current year's workforce dashboard which contains:
Total active employees for the current month
New hires, regularized, and separated for the current year
Employee status by department
This information can also be exported into helps format.
Step 4: Access Other Dashboards
We also have the following dashboards available:
Absentee dashboard
Attendance dashboard
General workforce over time dashboard
Lead dashboard
Location and attendance dashboard
You can use these dashboards according to your preference.
Step 5: Explore Finance Dashboard
For finance, you have access to the payroll dashboard. You can filter by company, branch, year, amount, and department.
Step 6: Review Payroll Information
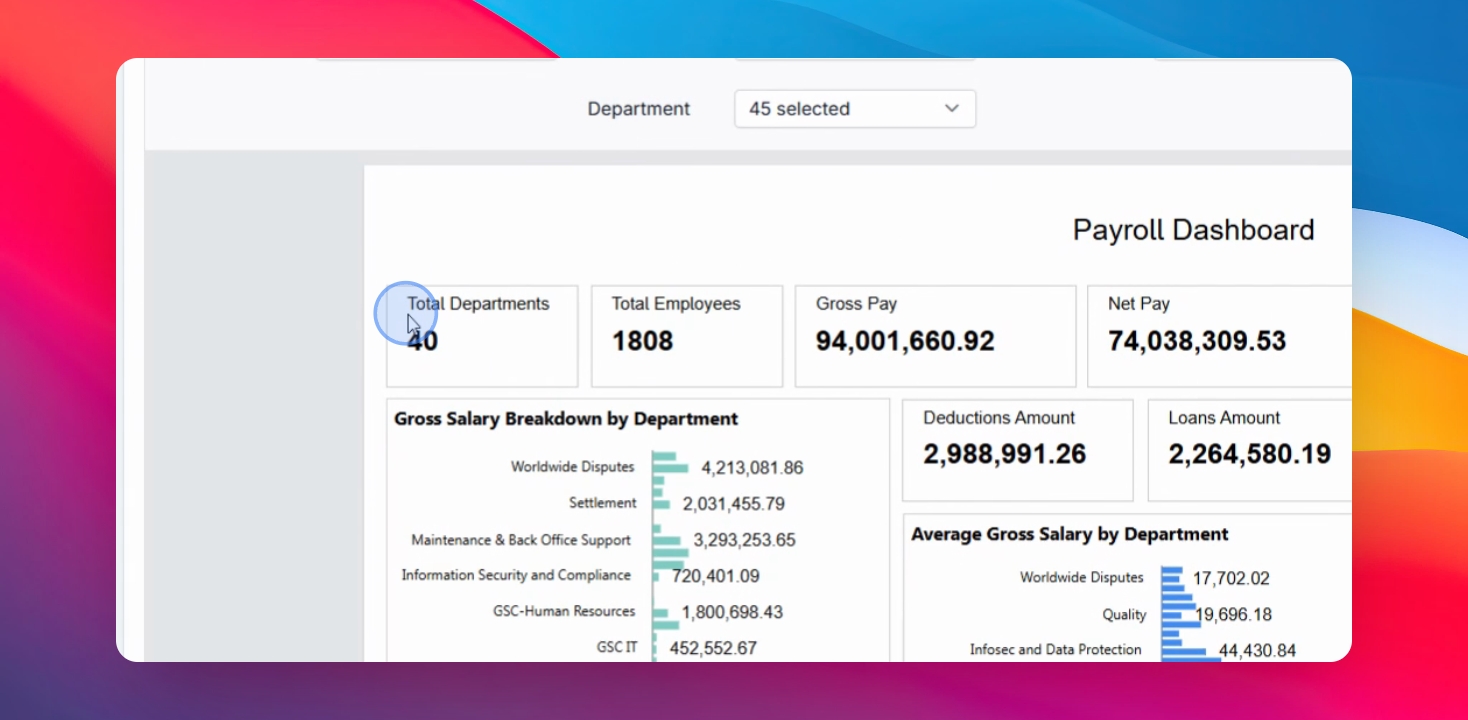
The payroll dashboard provides details on:
Total departments
Total employees
Gross pay
Net pay
Gross salary breakdown for department
Deductions amount
Average gross salary for department
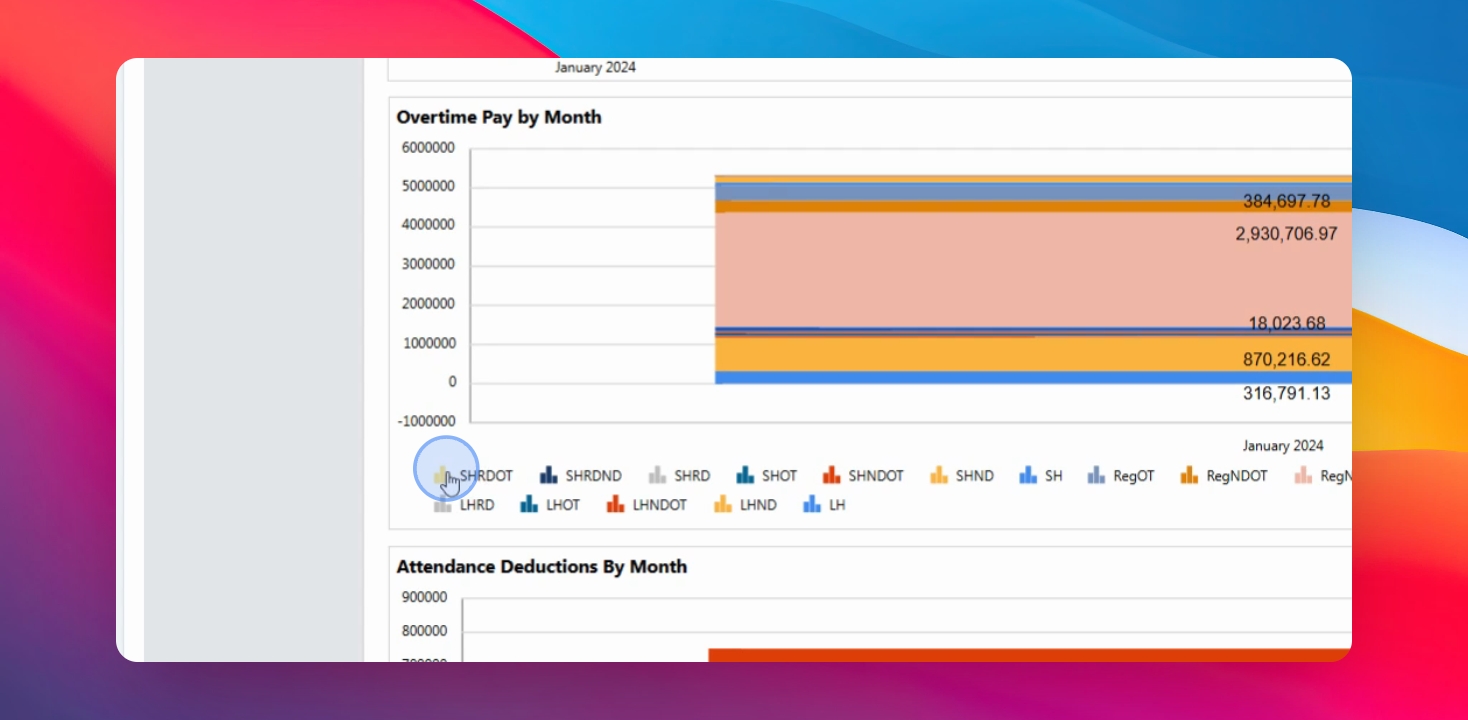
Step 7: Analyze Attendance Payments
On the attendance quiz, you can view premium payments in different colors or charts. This data can also be exported through Excel.